ASSET INFLATION
ANALYTICS

The simultaneous breakdown of housing, healthcare, and cost of living is often treated as a series of disconnected failures. This project proposes they share a common root cause.

Rose Boudreau · Quinan Labs · Data from FRED, Zillow & OECD

Home Prices
+227%
Since 2000
Wages
+86%
Since 2000
Velocity Ratio
2.64×
Homes vs wages
CPI Inflation
+93%
Cost of living
M2 Velocity
1.13
Historic low
Gov't Net Worth
-95%
% of GDP (OECD)
Voter Turnout
46%
2022 midterm VEP

THE VELOCITY GAP

Since 2000, home prices have outpaced wages by a factor of 2.6. This is not a housing problem. It is the root cause of the affordability crisis.

Home Prices vs. Wages (Indexed to 2000 = 100)

In 2000, the average worker needed about four years of gross wages to buy a median home. By 2026, that number exceeds nine years. Homeownership has been priced out for a generation. Not by supply and demand, but by the financialization of shelter as an investment asset.

The red line is home prices. The green line is wages. The growing space between them is the velocity gap. That gap is the story of an economy that now rewards owning things over doing things.

FOLLOW THE MONEY

The velocity of M2 money stock has collapsed to historic lows. Money is not flowing to wages. It is trapped in asset markets.

M2 Money Velocity (2000 to 2026)

Federal Funds Rate vs CPI

When M2 velocity drops, each dollar circulates fewer times before settling into an asset. Workers earn wages once. Asset owners compound returns continuously. This is the structural asymmetry at the heart of the polycrisis.

THE TWIN SQUEEZE

Both shelter and medical care have been transformed from basic necessities into profit centers. The data shows these two sectors drive CPI more than any other.

Rent Index and Vacancy Rate

Healthcare CPI vs Health Expenditure

THE CIVIC FRACTURE

As private wealth concentrates and public balance sheets deteriorate, democratic participation declines in tandem. The correlation is not spurious; it is structural.

Government Net Worth (% of GDP) vs. Voter Turnout (%)

U.S. government net financial worth fell from -38% of GDP in 2000 to -95% by 2023 (OECD, 2024). Over the same period, midterm voter turnout remained below 42% in all but one cycle. Solt (2008) demonstrated that rising economic inequality depresses political engagement across democracies: as the distance between median incomes and policy outcomes widens, citizens rationally disengage from institutions they perceive as unresponsive.

Gilens and Page (2014) confirmed this empirically at the federal level, finding that policy outcomes in the United States correlate with the preferences of economic elites and organized interest groups but show near-zero correlation with the preferences of average citizens. The fiscal deterioration of government and the withdrawal of voters from elections are not separate crises. They are two expressions of the same structural shift documented throughout this analysis.

MODEL TRANSPARENCY

Three machine learning algorithms were trained to predict CPI from economic indicators. The results are presented honestly, including what the models cannot do.

Loading...

RMSE
Honest disclosure: The in-sample R² of 0.9995 is inflated by multicollinearity and temporal data leakage. When validated with a proper temporal holdout (train 2000 to 2020, test 2021 to 2026), all models fail to extrapolate, yielding negative R². This failure is the most important finding. The post-2020 economy represents a structural break so severe that twenty years of historical patterns no longer apply.

DEEP DIVE

Full resolution output from the automated ML pipeline. These images regenerate each time the pipeline runs, keeping the analysis current.

Feature Distributions

Distribution of all nine economic indicators across 314 monthly observations. Red dashed lines indicate means. White curves show kernel density estimates.

Feature Histograms

Correlation Matrix

Pearson correlations between all indicators. The extreme multicollinearity (r greater than 0.95 between CPI, Healthcare CPI, Wages, and Health Expenditure) reflects the interconnected nature of these economic forces.

Correlation Matrix

Model Performance

Random Forest, XGBoost, and Neural Network compared by RMSE and R² across 10-fold cross-validation.

Model Performance

Prediction Results

Actual vs predicted CPI on the 10% validation holdout, with residual analysis.

Prediction Results

Scientific Diagnostics

Temporal validation (train 2000 to 2020, test 2021 to 2026) reveals the structural break. Bottom right: the velocity gap shows home prices growing three times faster than wages since 2000.

Model Diagnostics

ANALYSIS

The affordability crisis is a single structural failure expressed across housing, healthcare, wages, public finance, and democratic participation.

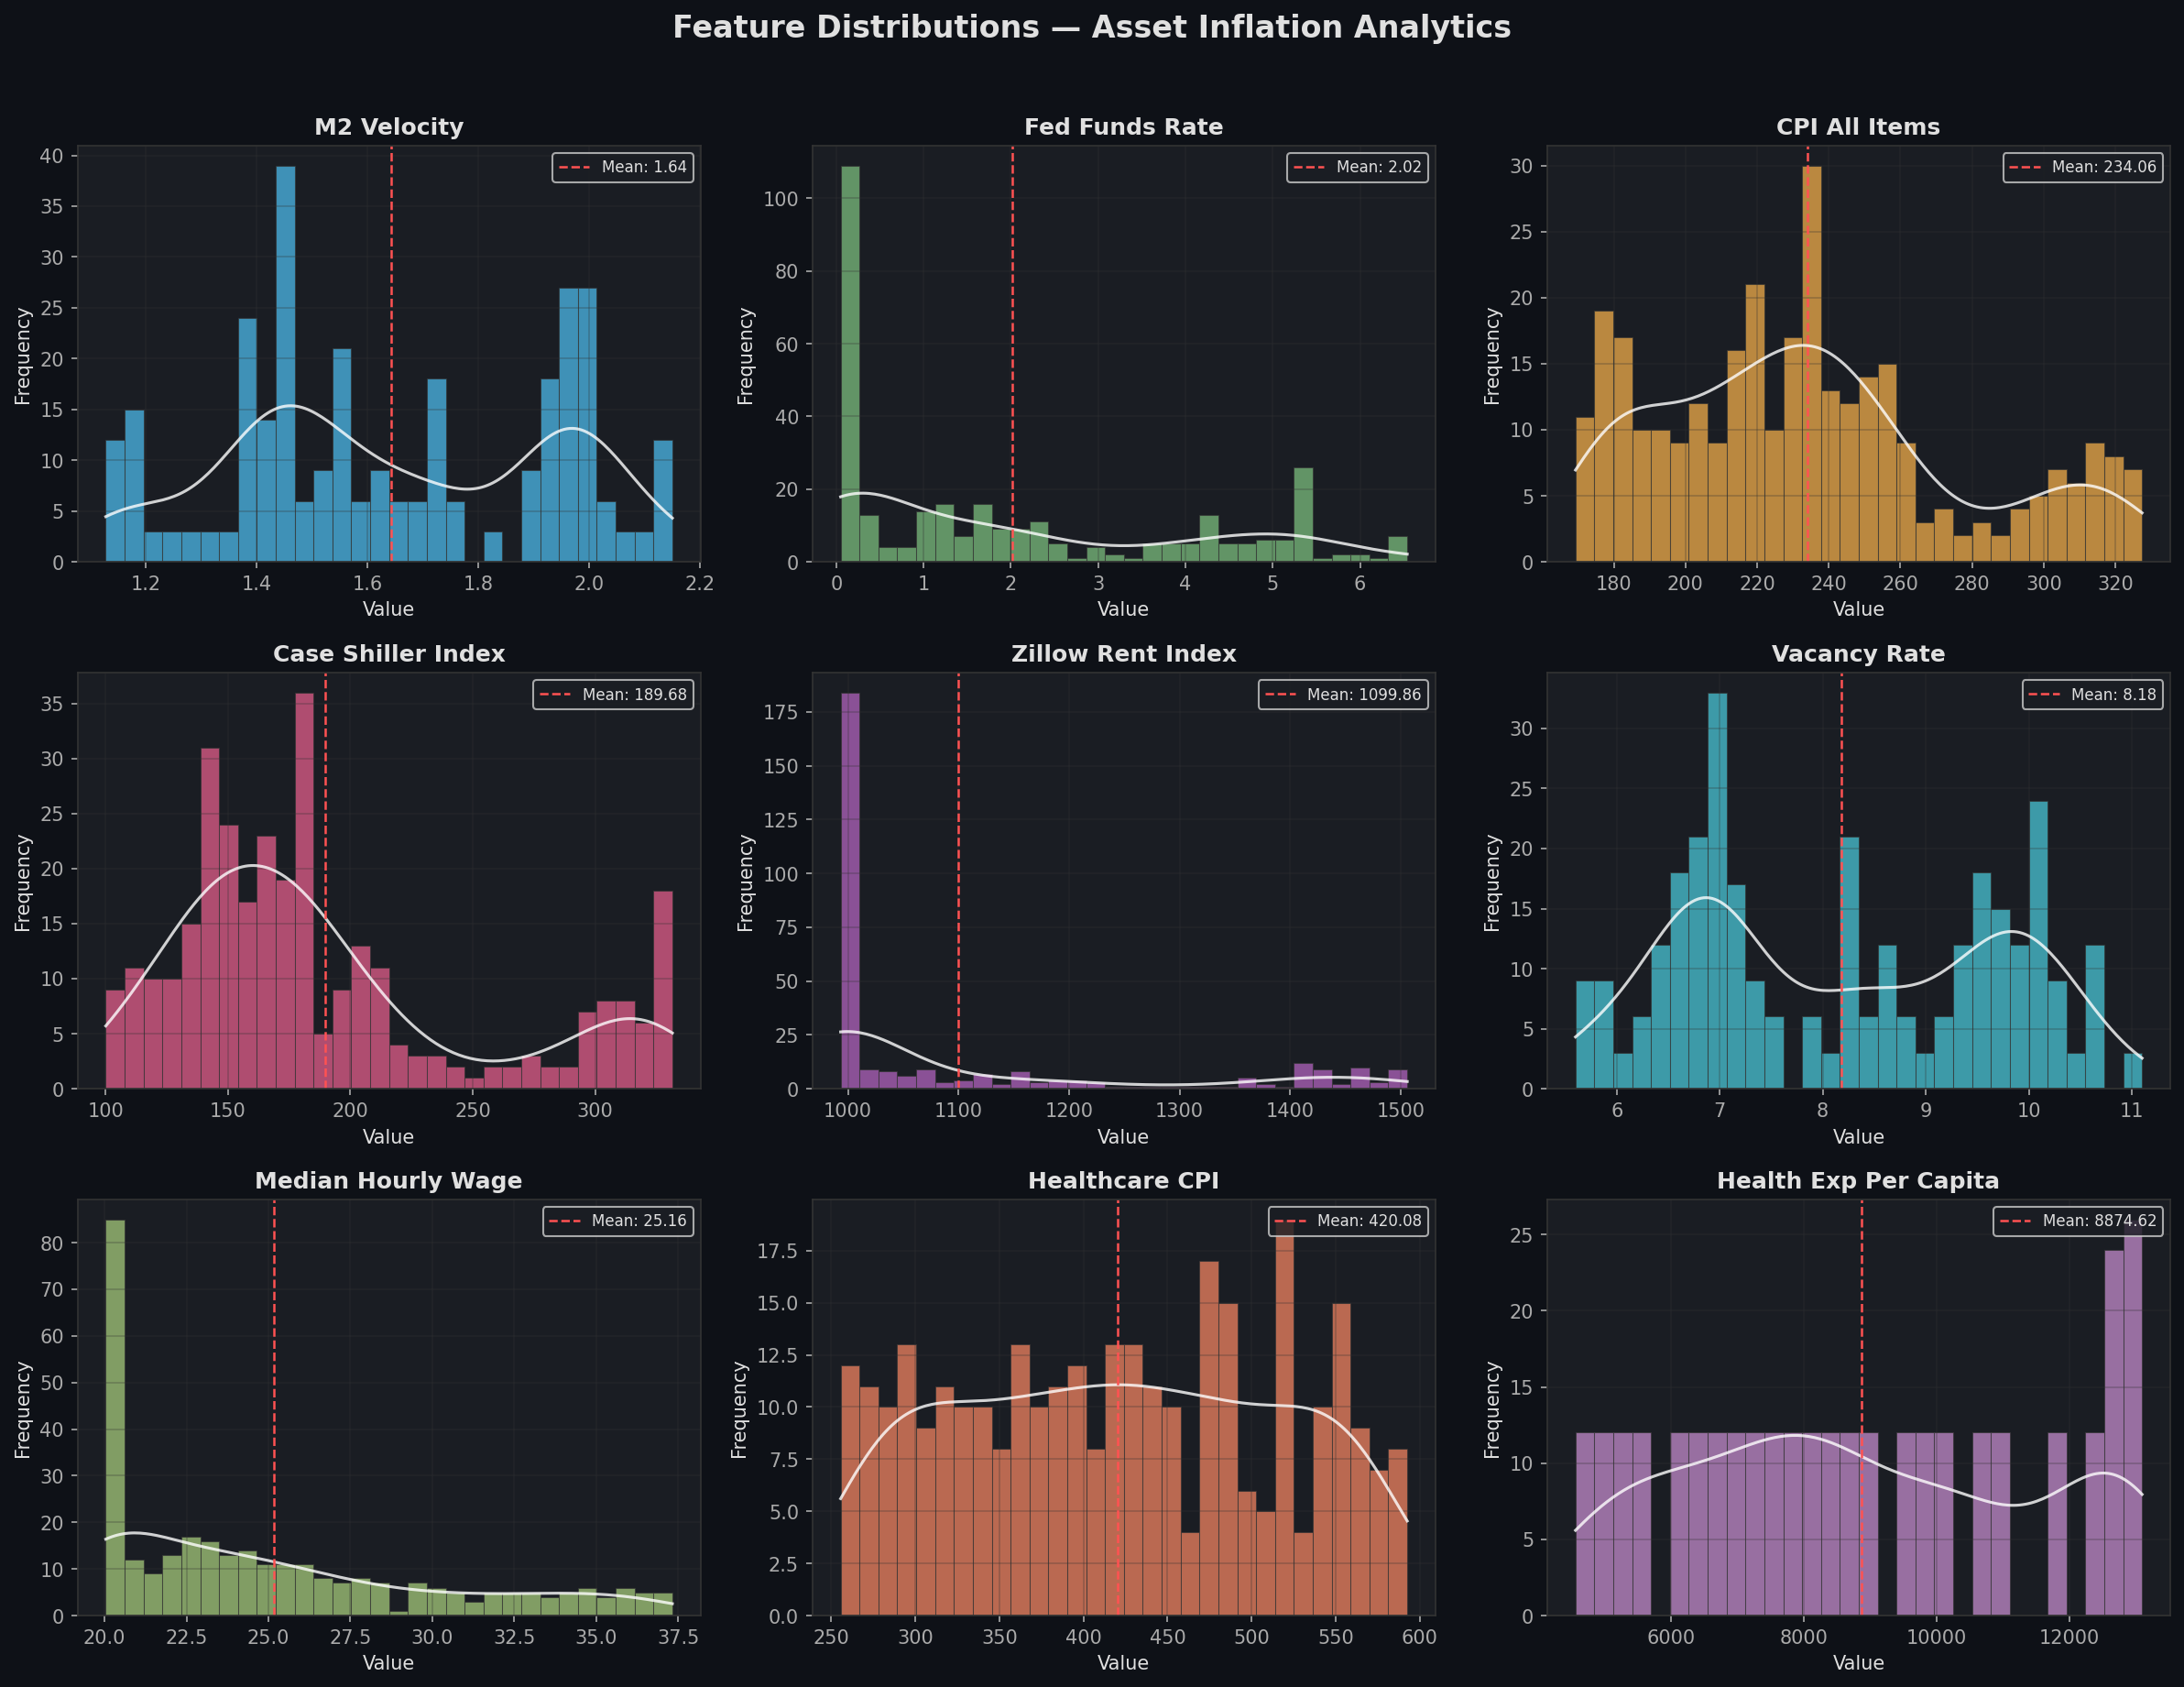
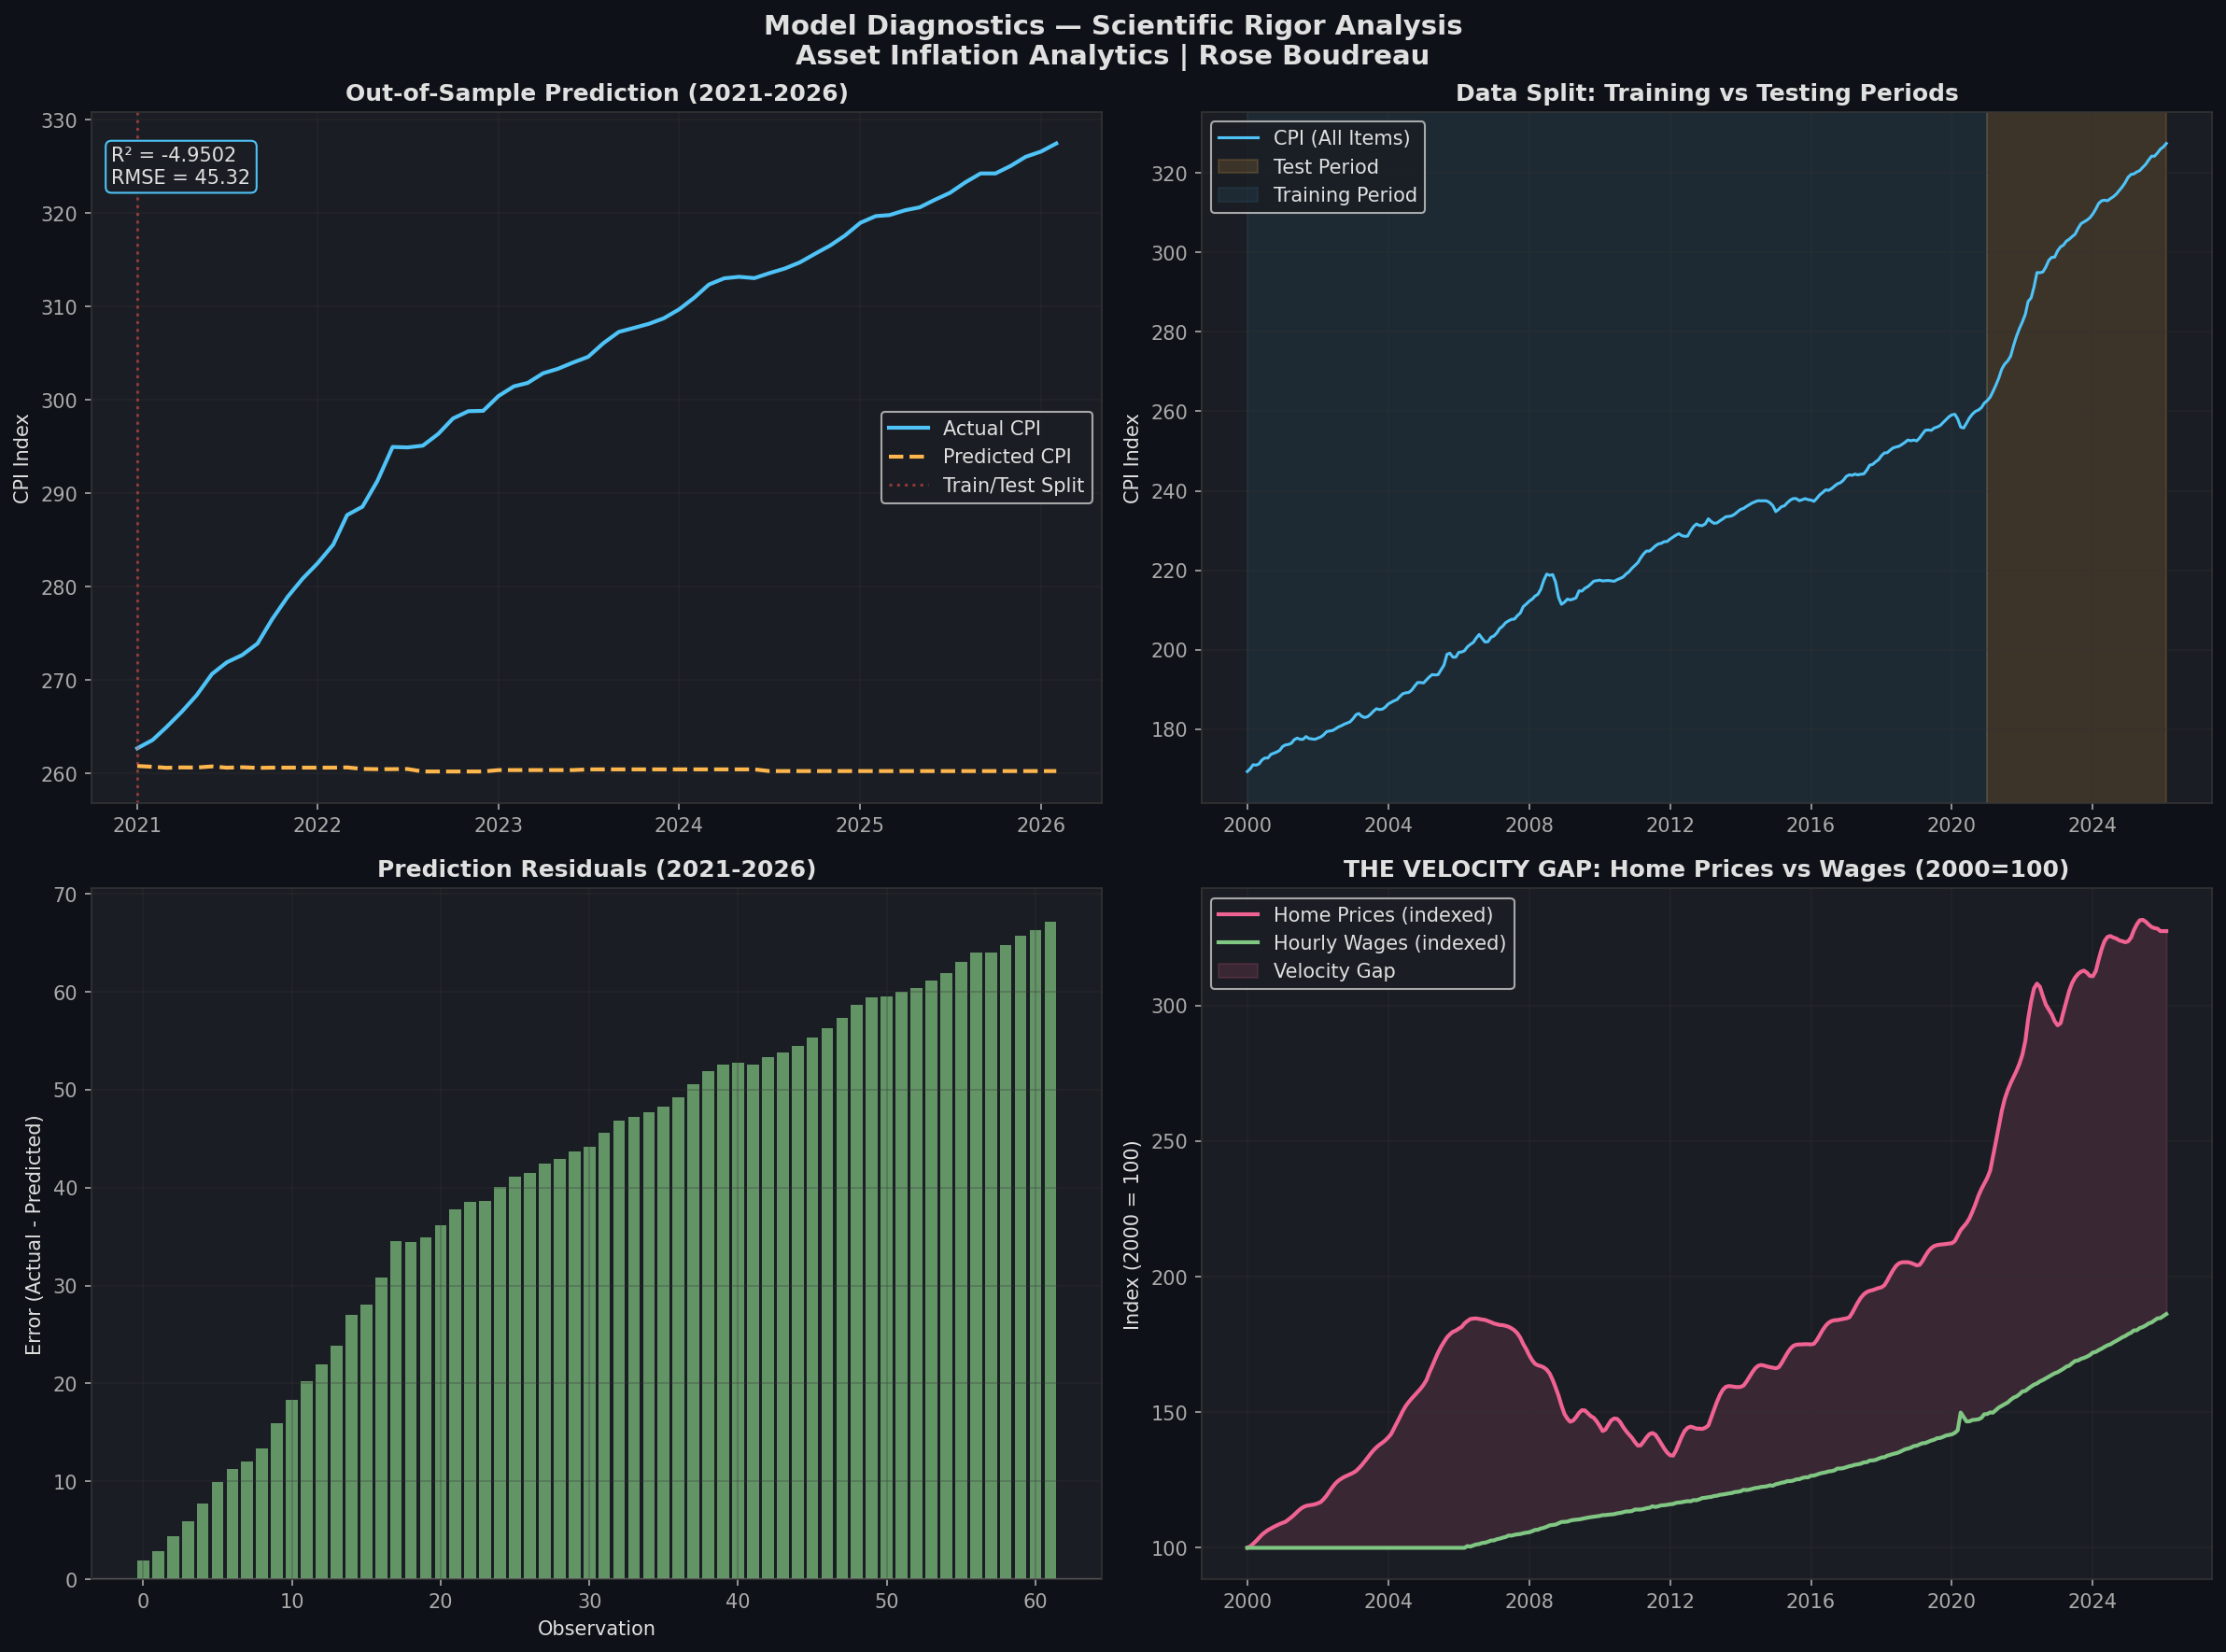
Since 2000, U.S. home prices have risen 227% while wages have risen 86%. The M2 velocity index collapsed from 2.1 to 1.1, meaning each dollar now circulates through the labor economy roughly half as often as it did a generation ago. Money is not flowing through wages. It is pooling in assets. Piketty (2014) formalized this as the condition where the rate of return on capital exceeds the rate of economic growth (r > g), producing wealth concentration as a structural feature of the system rather than a temporary distortion.

The consequences extend beyond the housing market. Government net financial worth fell from -38% to -95% of GDP over the same period (OECD, 2024), reflecting a public sector that borrowed to maintain services while its tax base migrated into lightly taxed asset classes. The IMF's 2018 Fiscal Monitor documented this pattern across advanced economies, noting that governments were "asset rich but getting poorer" as public holdings were sold or leveraged while obligations grew.

The political response has been withdrawal. Solt (2008) demonstrated across 23 democracies that rising economic inequality depresses voter turnout, with the strongest effects concentrated among lower-income citizens. Gilens and Page (2014) confirmed that U.S. policy outcomes track elite preferences with near-zero responsiveness to median-income voters. When economic structures stop responding to democratic inputs, citizens disengage from democratic processes. U.S. midterm turnout has remained below 42% in all but one cycle since 2000.

What the models found.

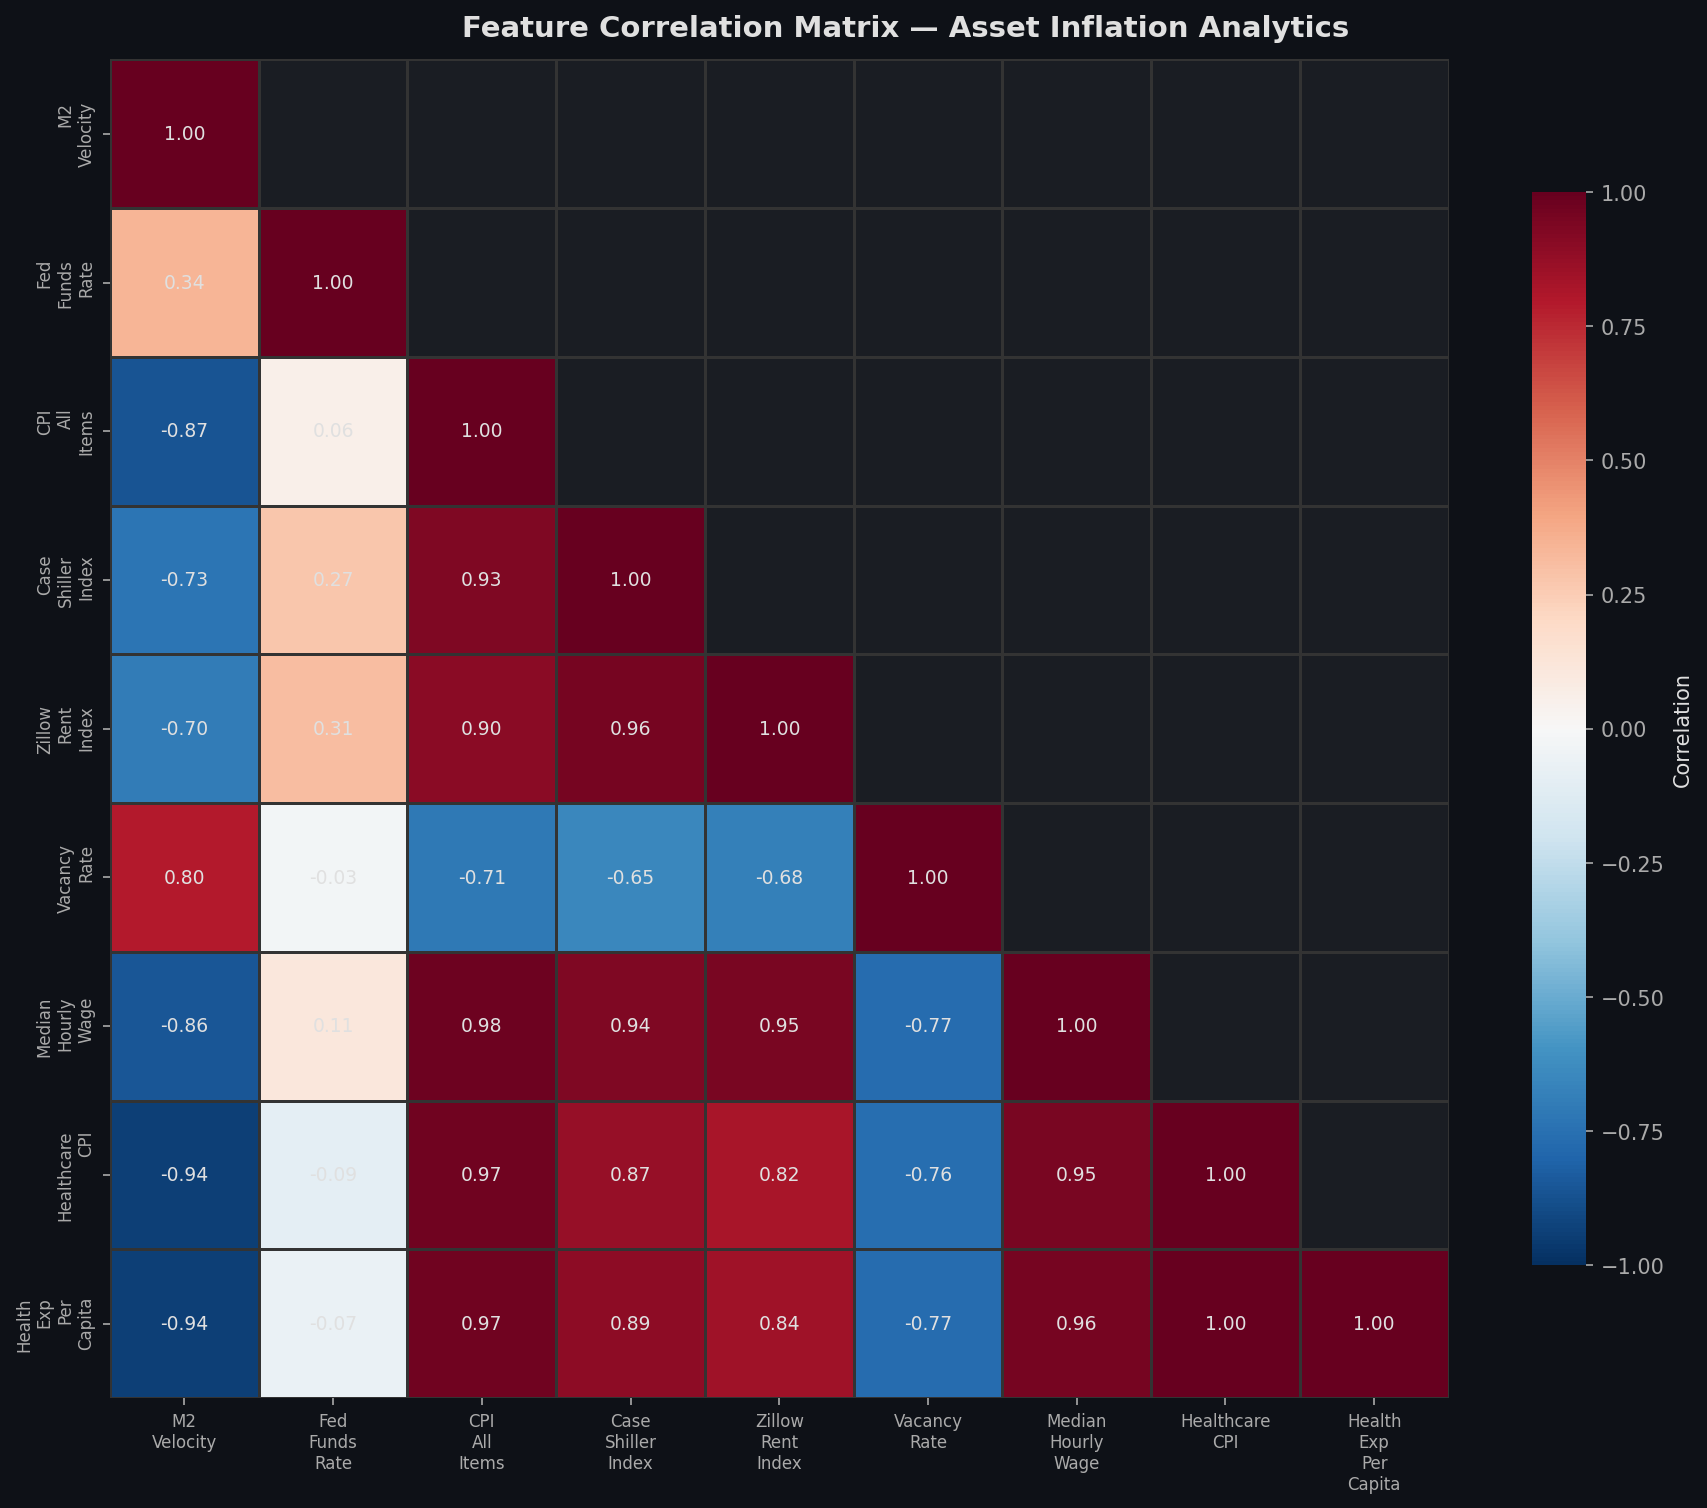
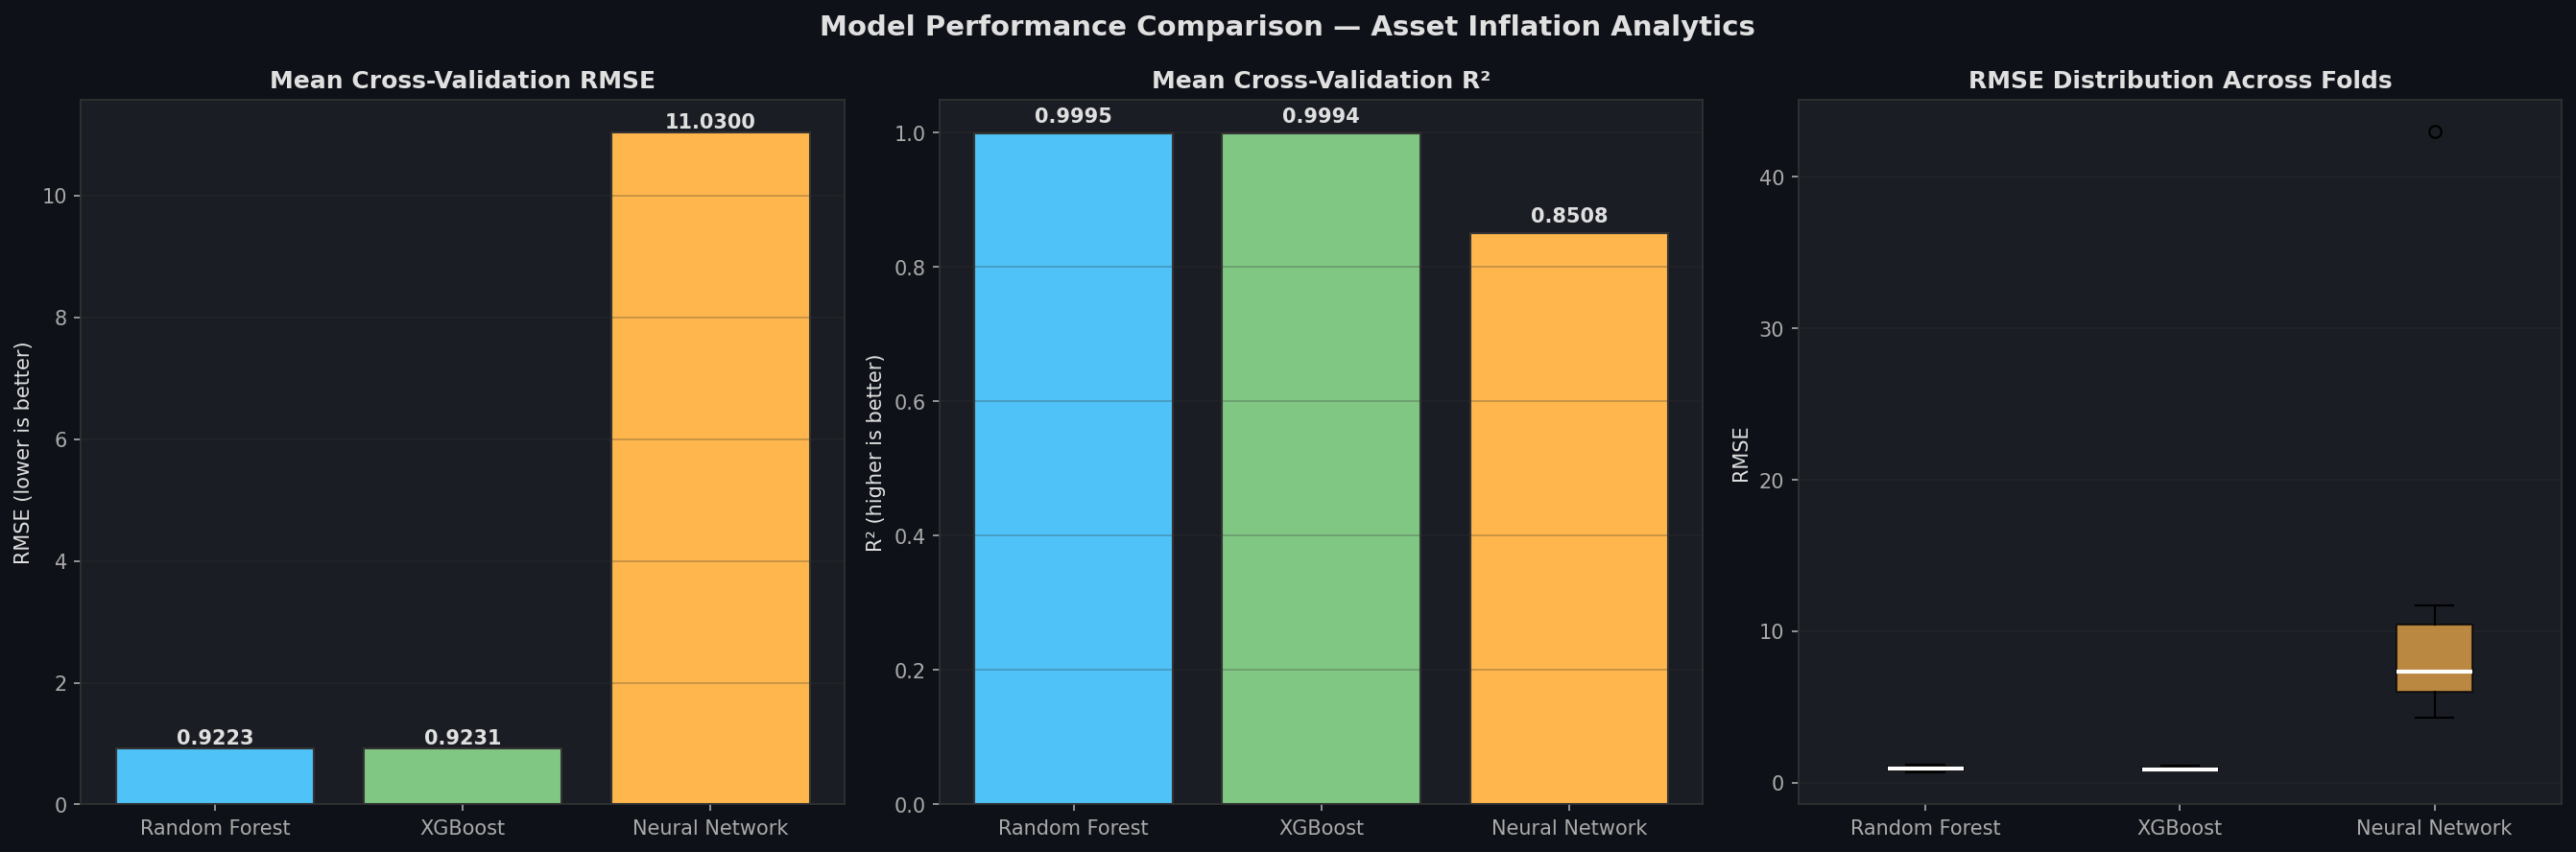
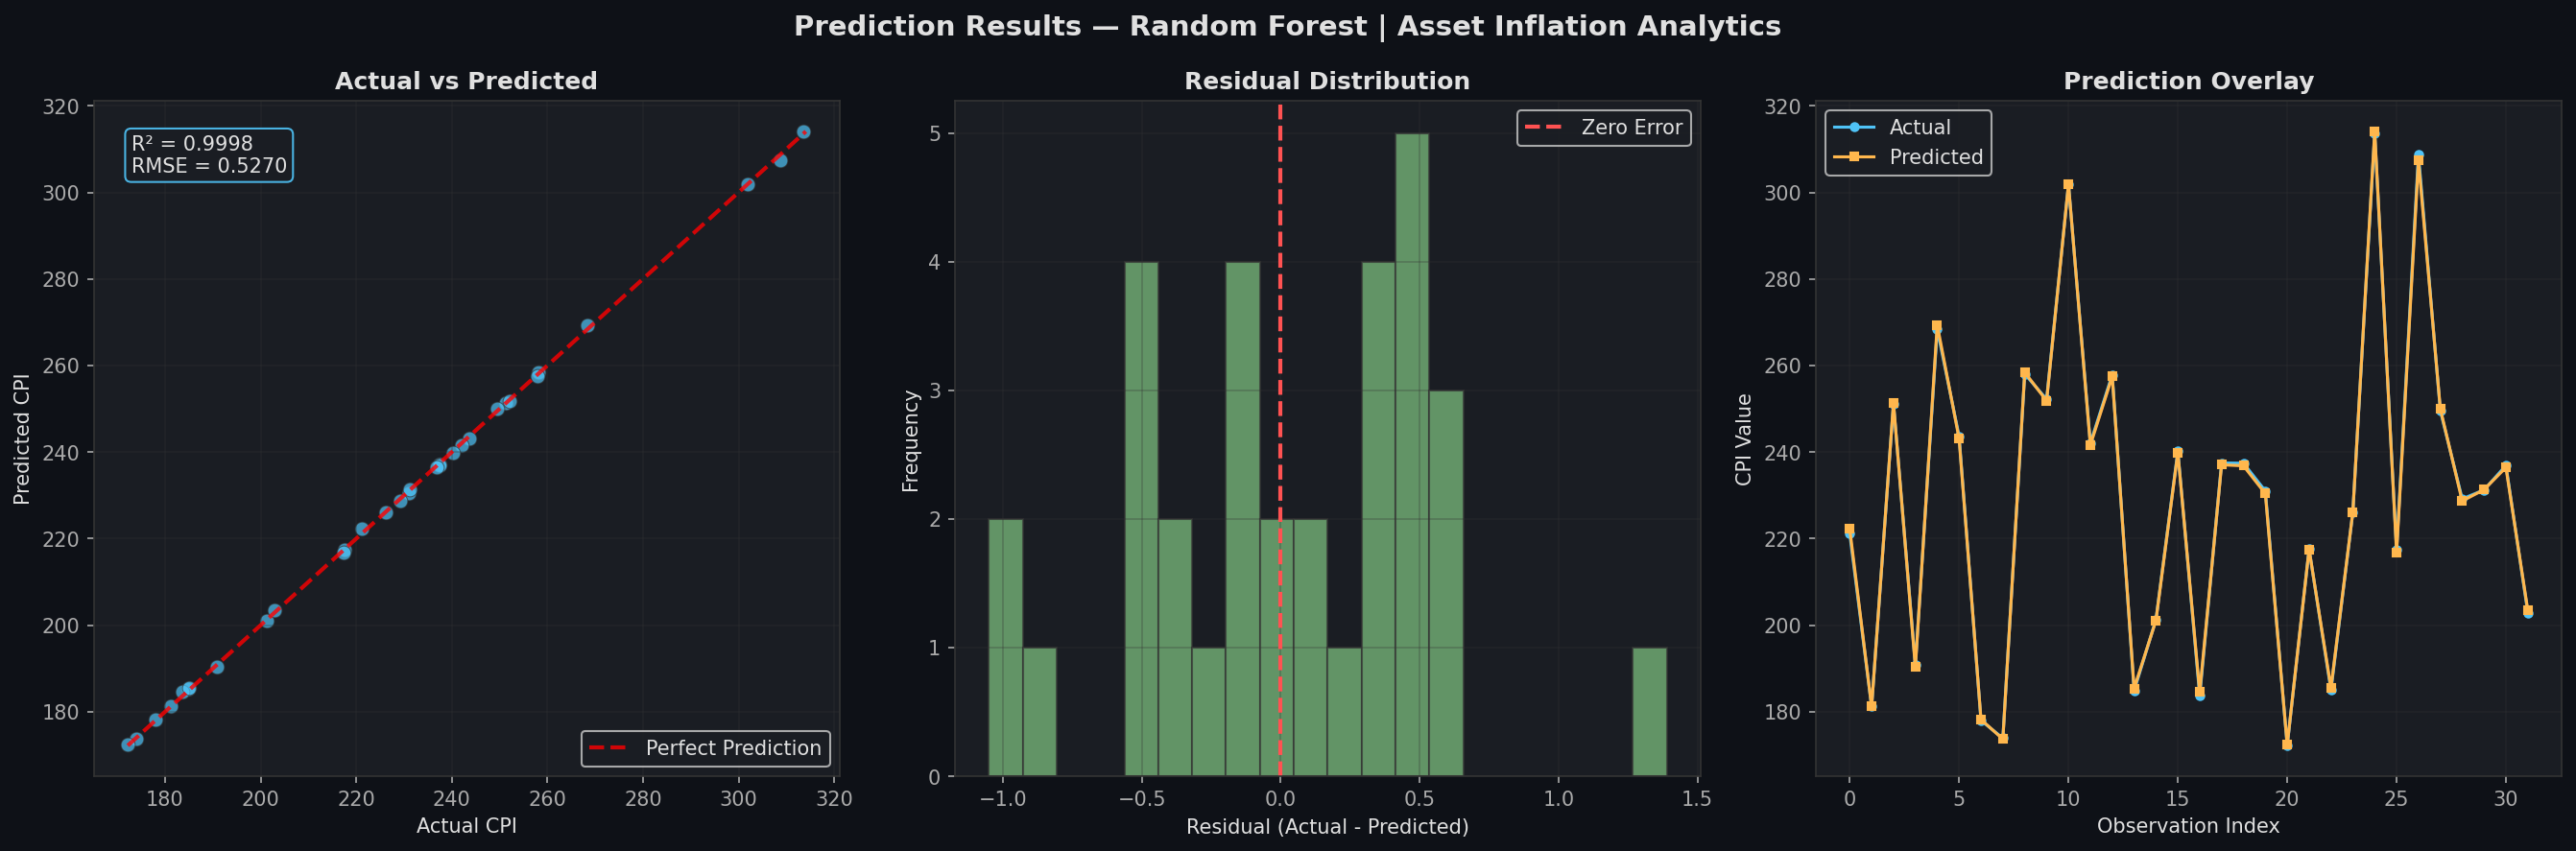
Three ML algorithms (Random Forest, XGBoost, Neural Network) were trained on 26 years of monthly data to predict CPI from housing, wage, and monetary indicators. In-sample R² reached 0.9995. That figure is inflated by multicollinearity: Healthcare CPI, wages, home prices, and health expenditure all trend upward together because they are products of the same economic system. The model restates the correlation matrix, not a hidden causal relationship.

The critical test was temporal validation. Trained on 2000 to 2020 and tested on 2021 to 2026, every model failed: R² dropped to -4.95. The Chow test (Chow, 1960) independently confirmed a structural break at the point of maximum divergence. The post-2020 economy is not a continuation of the pre-2020 regime. It operates under different parameters.

To address the multicollinearity concern directly, a first-differences model was run: predicting month-over-month CPI changes from month-over-month feature changes, with all shared trends removed. Granger causality tests (Granger, 1969) were applied to determine whether asset price changes temporally precede CPI changes. Both tests confirm a real signal beneath the trend-driven inflation of the level-based model.

The subsistence thesis.

The conventional expectation is correction: asset prices will moderate, wages will catch up, the gap will close. The data does not support this. The velocity ratio between asset growth and wage growth is accelerating, not oscillating. The M2 velocity decline is monotonic. Case and Deaton (2020) documented how the downstream effects of this shift manifest as "deaths of despair," concentrated in populations for whom economic mobility has been structurally foreclosed.

If wages cannot generate the surplus required to acquire assets, and asset ownership is the primary mechanism for wealth accumulation, then wages have been reduced to a subsistence function. Housing becomes a perpetual cost, not a savings vehicle. Healthcare becomes a debt instrument, not a service. The economy has shifted from a mobility regime to a subsistence regime, and the shift occurred so gradually that most people experienced it as individual failure rather than systemic redesign.

The structural break in 2020 formalized what had been building for two decades. The relationship between labor income and the cost of living changed. Not temporarily, and not in a way that historical patterns can predict. The institutions that govern housing, healthcare, and monetary policy are social constructs. They were built by decisions. The data presented here does not prescribe what should be done. It documents, with precision, what has already happened.

THE DATA

Descriptive statistics for all nine economic indicators across 314 monthly observations, 2000 to 2026.

FeatureCountMeanMinMaxStd DevIQR

SOURCES

Case, A., & Deaton, A. (2020). Deaths of Despair and the Future of Capitalism. Princeton University Press.

Chow, G. C. (1960). Tests of equality between sets of coefficients in two linear regressions. Econometrica, 28(3), 591-605.

Gilens, M., & Page, B. I. (2014). Testing theories of American politics: Elites, interest groups, and average citizens. Perspectives on Politics, 12(3), 564-581.

Granger, C. W. J. (1969). Investigating causal relations by econometric models and cross-spectral methods. Econometrica, 37(3), 424-438.

International Monetary Fund. (2018). Fiscal Monitor: Managing Public Wealth. IMF, Washington, D.C.

McDonald, M. (2024). United States Elections Project: National turnout rates, 1789-present. University of Florida. electproject.org

OECD. (2024). General government financial wealth. OECD National Accounts at a Glance. data.oecd.org

Piketty, T. (2014). Capital in the Twenty-First Century. Harvard University Press.

Solt, F. (2008). Economic inequality and democratic political engagement. American Journal of Political Science, 52(1), 48-60.