The polycrisis is not a series of coincidences. It is a single structural failure expressing itself across every domain of daily life.
Housing became unaffordable. Healthcare became extractive. Wages stagnated while the cost of existing kept climbing. We tend to discuss these as separate policy issues, each with its own lobby, its own talking points, its own proposed fixes. But when you lay the data side by side, the pattern is clear. These are not independent problems. They share a root cause.
The root cause is asset inflation driven by the velocity of money in capital markets outpacing the velocity of money in labor markets. That sentence deserves unpacking, because it describes the mechanism through which an entire generation has been priced out of stability.
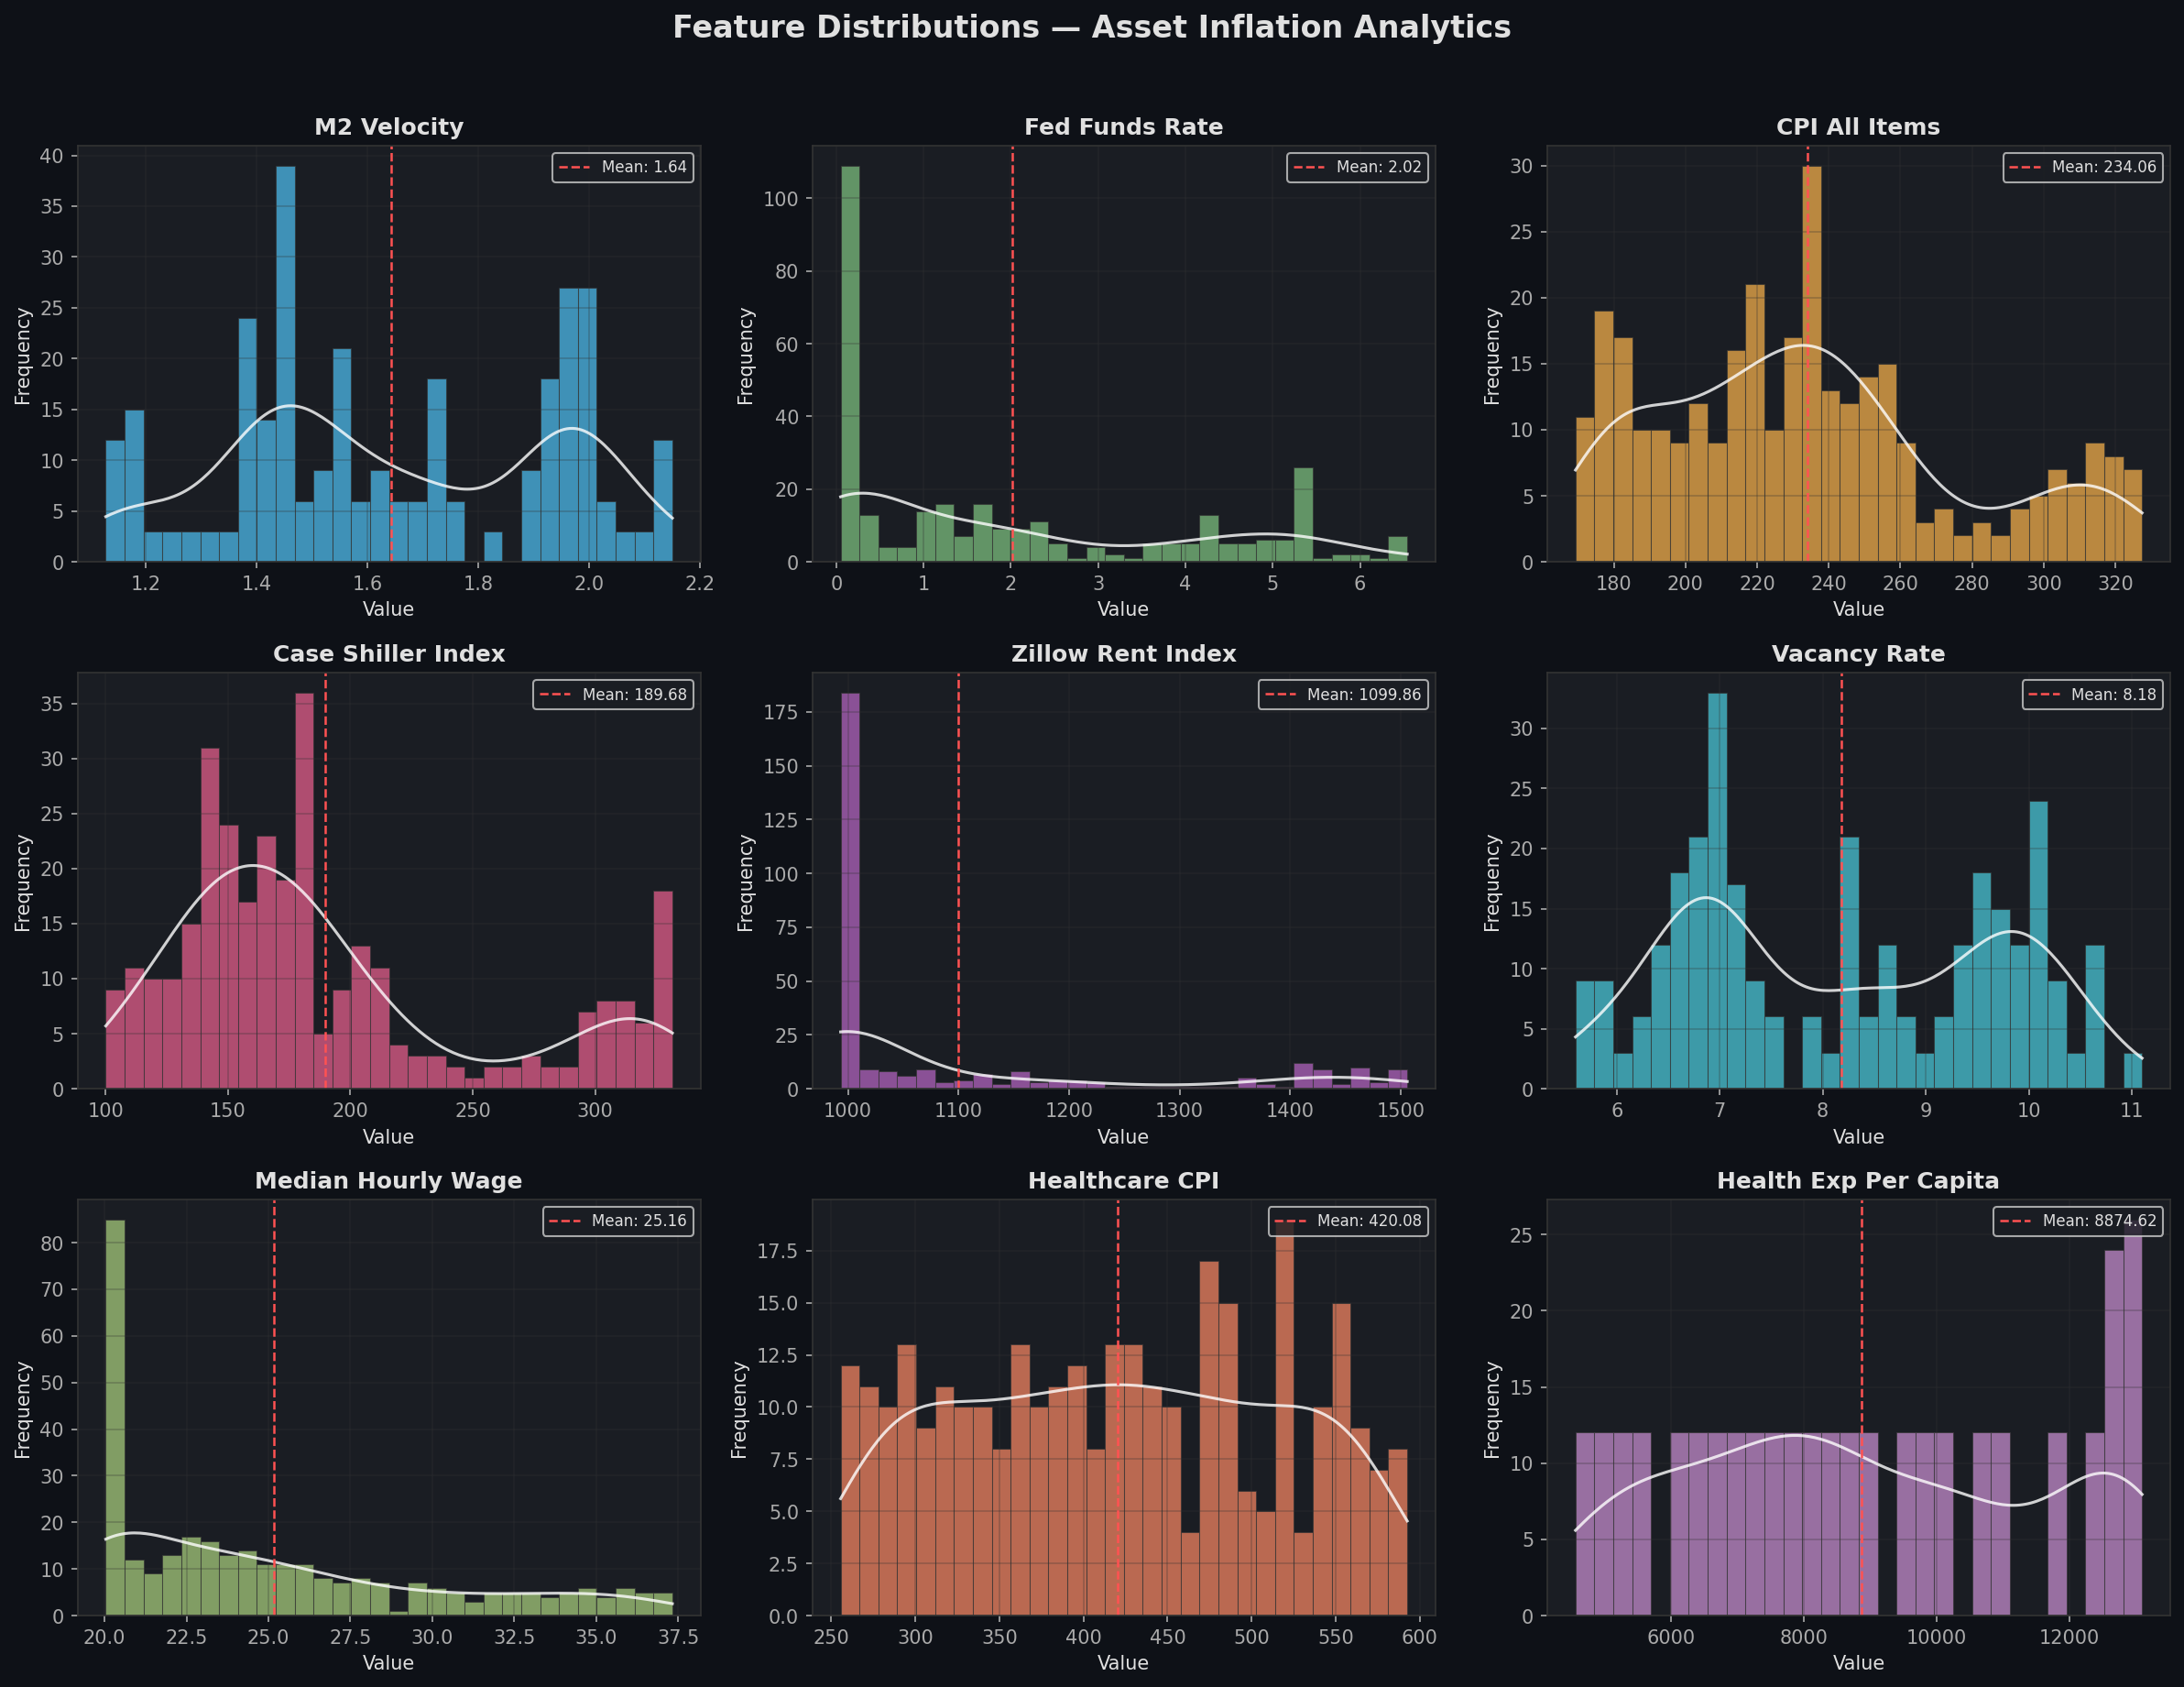
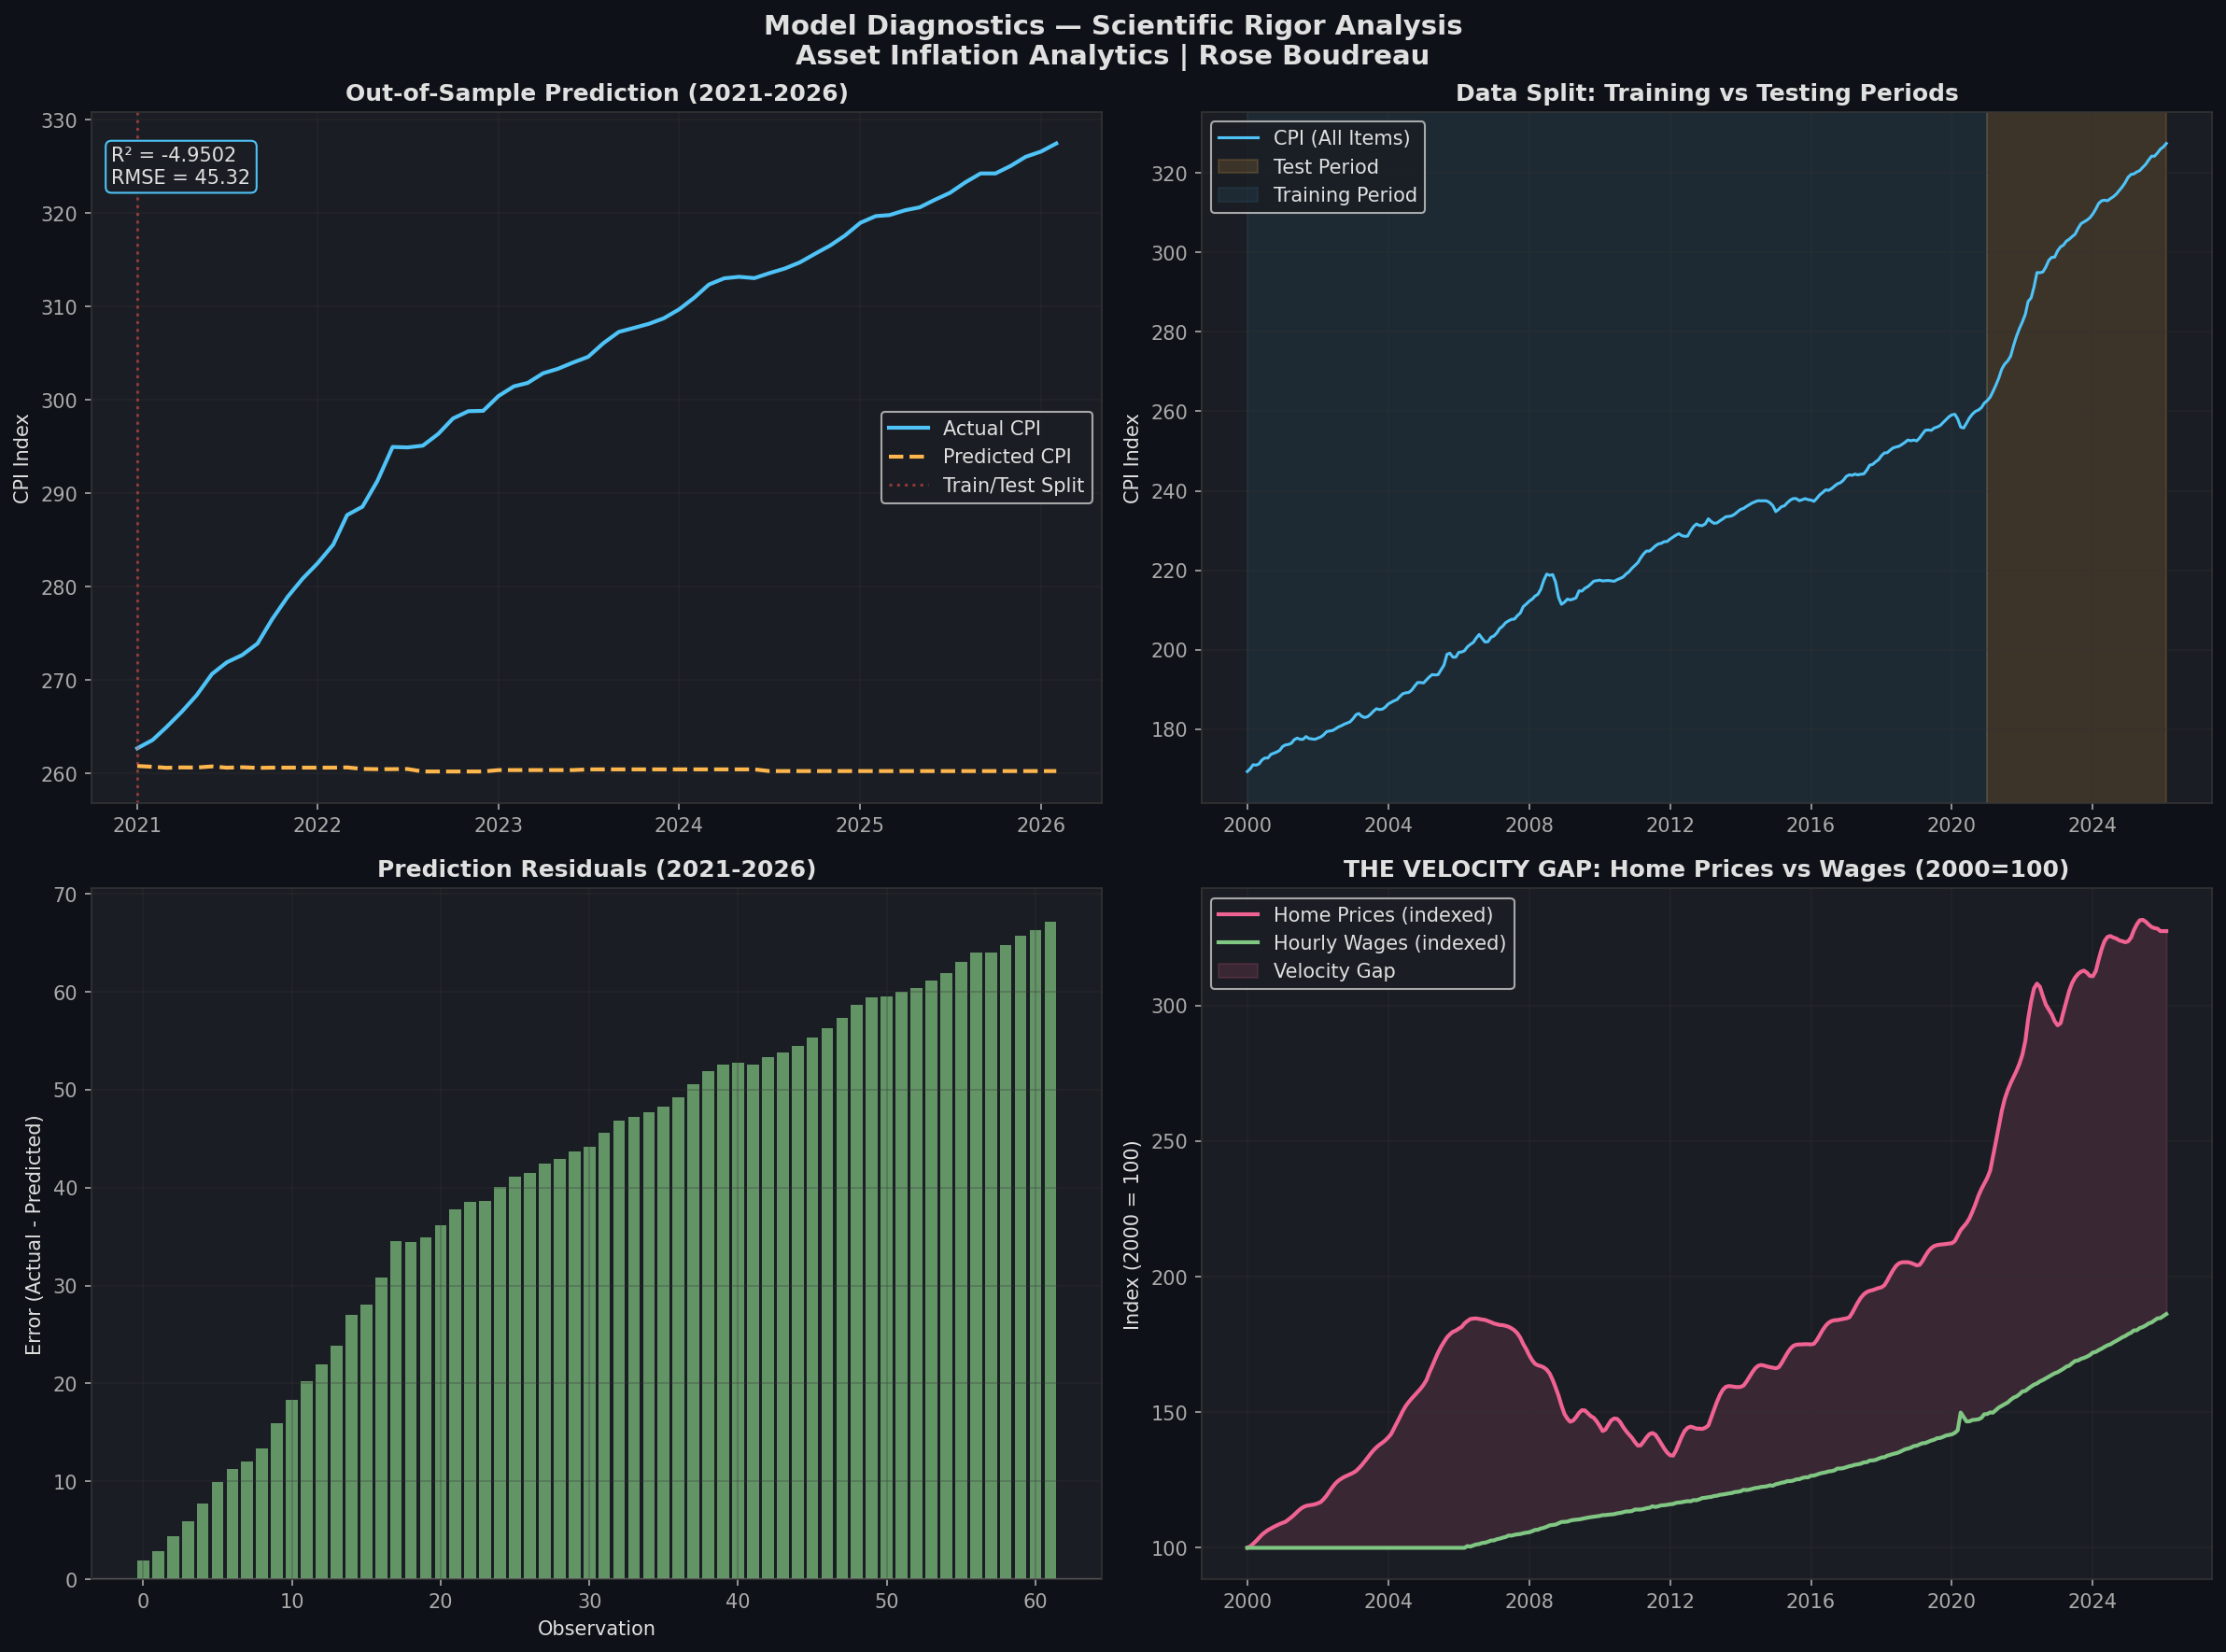
When money moves through the economy, it either circulates through wages, goods, and services, or it accumulates in assets like real estate, equities, and financial instruments. For most of the 20th century, those two circuits moved in rough proportion. After 2000, they diverged. Home prices grew 227% while wages grew 86%. The M2 velocity index, which tracks how fast money changes hands in the real economy, collapsed from 2.1 to 1.1. Money stopped flowing through labor. It pooled in assets.
This is not abstract finance. This is the mechanism by which rent became unaffordable, by which medical bills became the leading cause of bankruptcy, by which young people with full-time jobs cannot save for a home. The data does not require interpretation. It requires acknowledgement.
What the models tell us, and what they cannot.
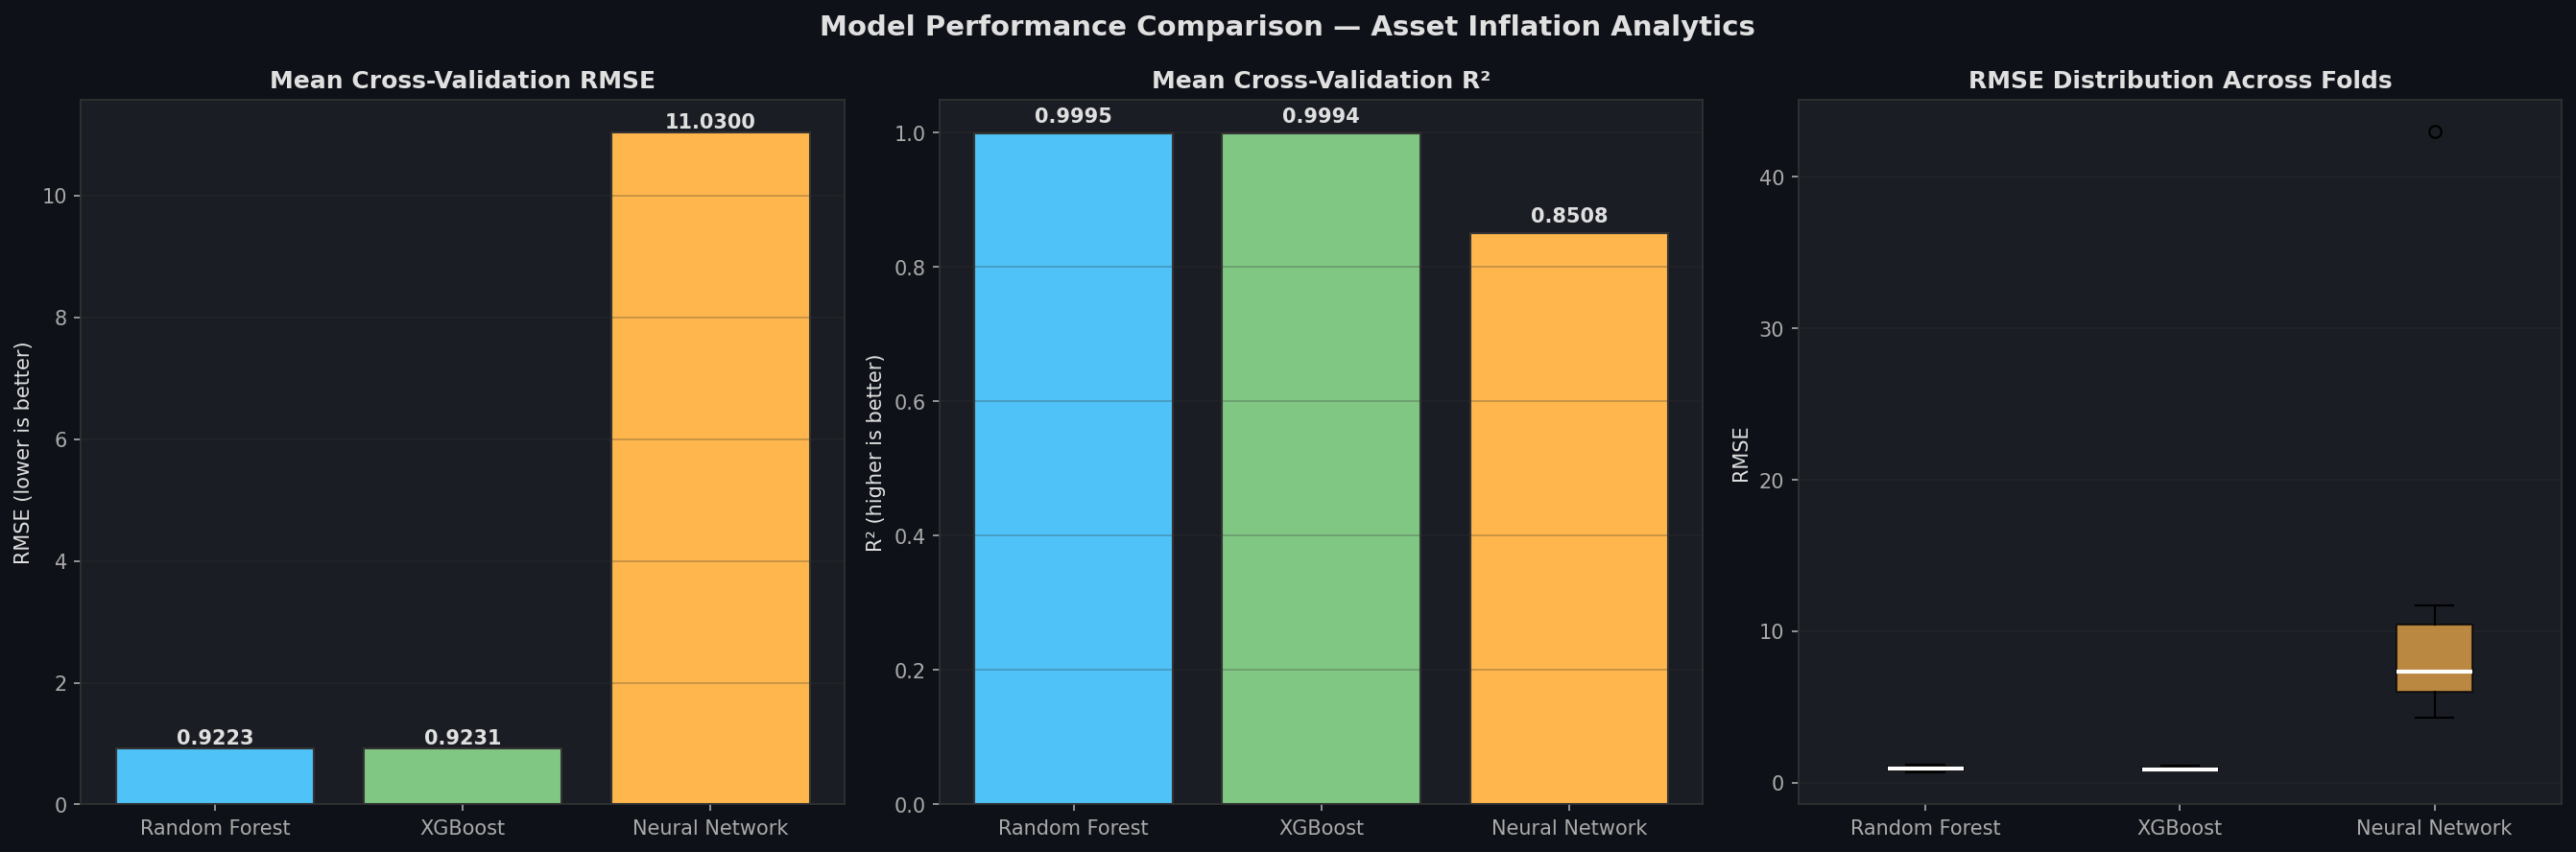
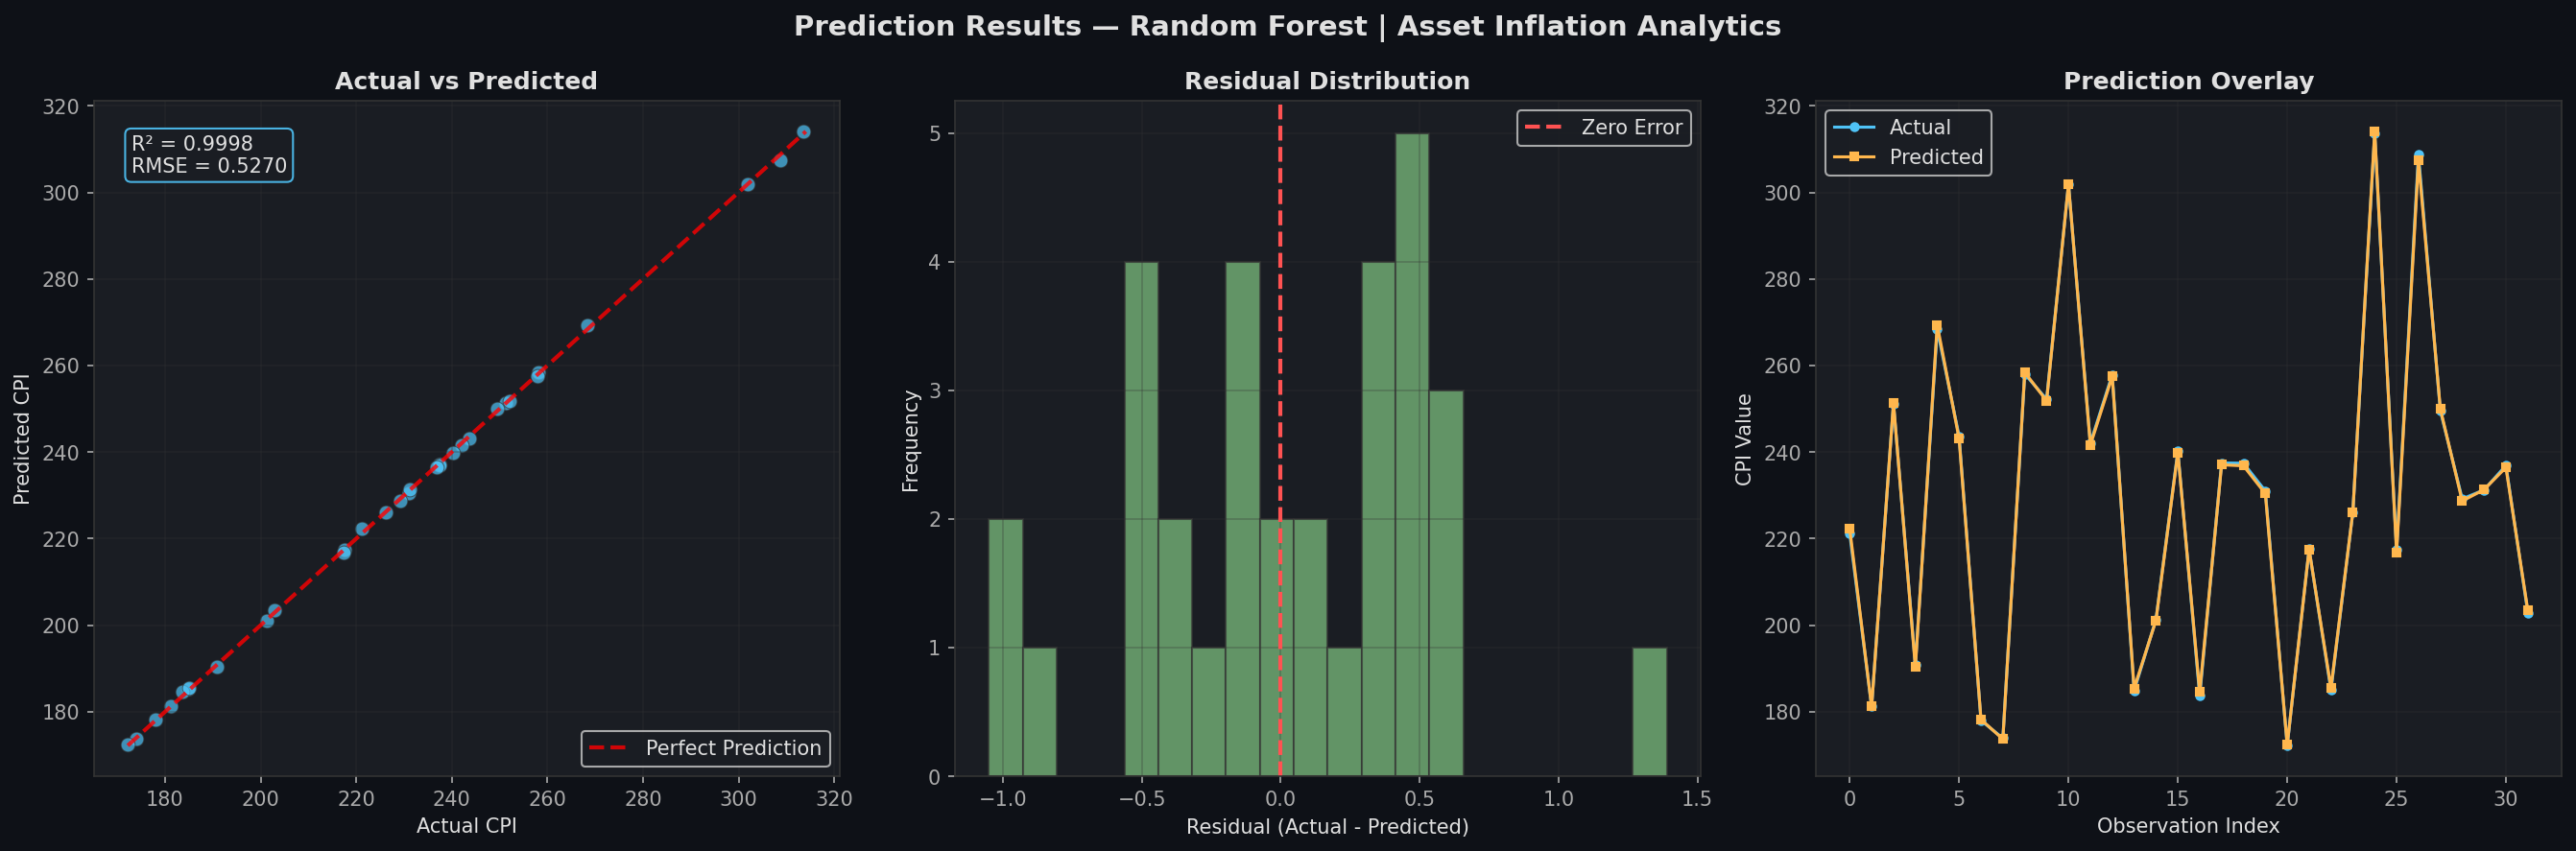
Three machine learning algorithms were trained on 26 years of monthly data from the Federal Reserve, Zillow, and the OECD. Random Forest, XGBoost, and a neural network all achieved near-perfect in-sample accuracy. On paper, the R² of 0.9995 suggests the model can predict CPI from housing, wages, and monetary indicators with extraordinary precision.
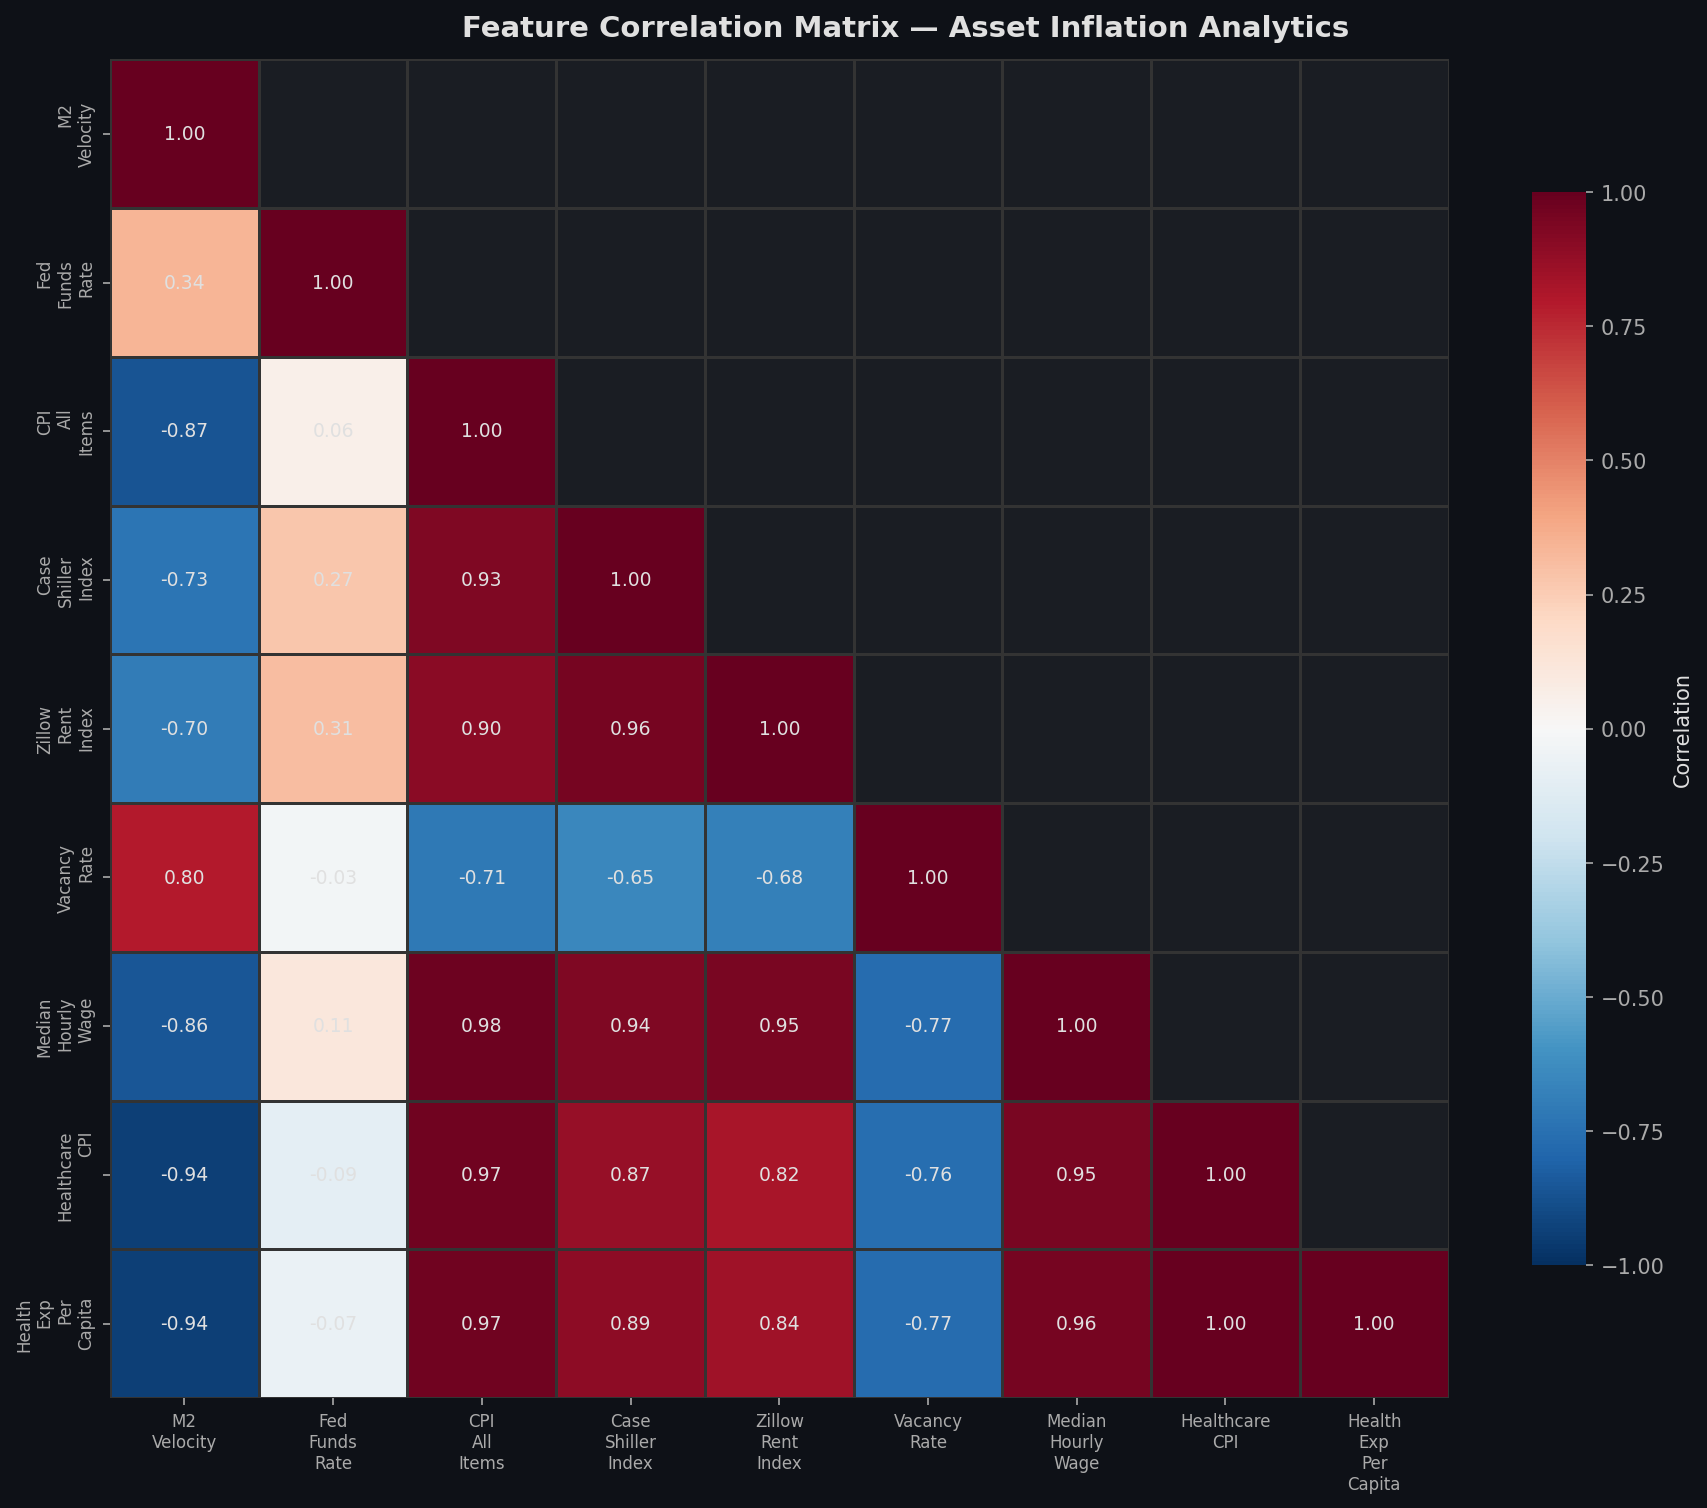
But that number is misleading if taken at face value, and scientific honesty requires saying so. The features are highly multicollinear. Healthcare CPI, wages, housing prices, and health expenditure all trend upward together over 26 years because they are all products of the same economic system. The model is not discovering a hidden relationship. It is restating what the correlation matrix already shows: these variables are structurally intertwined.
More importantly, when the model is trained on data from 2000 to 2020 and asked to predict 2021 to 2026, it fails completely. The R² drops to negative five. This is not a flaw in the algorithm. It is the most important finding in the entire analysis. The post-2020 economy broke the pattern. The relationship between these indicators shifted so fundamentally that two decades of historical data became unreliable for forward prediction.
That break corresponds to the COVID-era explosion in M2 money supply, the rapid rise in asset prices, and the inflation shock that followed. The models capture the pre-2020 world well. They cannot capture what came after, because what came after was not a continuation of the old pattern. It was a rupture.
What this means.
The status quo position on the affordability crisis is that markets will self-correct, that supply will eventually meet demand, that wages will catch up. The data presented here suggests otherwise. The velocity gap between asset returns and labor returns is not narrowing. It is accelerating. And the structural break in 2020 suggests we have entered a new regime that historical models cannot navigate.
Social constructs like housing markets, healthcare systems, and monetary policy are not forces of nature. They are shared creations. They were built by decisions, and they can be rebuilt by different ones. The data does not tell us what to do. It tells us what is happening, with enough clarity that we can no longer pretend otherwise.
The subsistence thesis.
Traditional economists expect a correction. Asset prices rose too fast, the argument goes, so they will come down. Wages are behind, so they will catch up. The data does not support this. The velocity ratio between asset growth and wage growth is not oscillating. It is accelerating. The M2 velocity collapse from 2.1 to 1.1 means each dollar now circulates roughly half as many times through the labor economy as it did in 2000. This is not a cycle. It is a ratchet. It only moves in one direction.
If wage labor can no longer generate enough surplus to acquire assets, and if asset ownership is the primary mechanism for wealth accumulation, then the function of wages has changed. You are no longer earning to build. You are earning to exist. Housing is not a purchase you are saving towards. It is a cost you are perpetually servicing. Healthcare is not a right you are exercising. It is a debt you are managing. The structure of the economy has quietly shifted from mobility to subsistence, and the shift happened so gradually that most people experienced it as personal failure rather than systemic design.
The structural break in 2020 confirms this. The models trained on twenty years of data cannot predict the post-2020 economy because the relationship between labor and capital changed. Not temporarily. The rules changed. The social constructs of housing markets, healthcare systems, and monetary policy were built to serve the status quo. The status quo has shifted from "work hard and you can own a home" to "work hard and you can afford rent." That is not a policy failure. It is the social construct functioning as designed, for a different set of beneficiaries.
This is difficult to sit with, even for someone trained to see it. The complexity of the knowledge required to understand these implications is itself part of the problem. The mechanisms are obscured behind jargon, behind quarterly reports, behind decades of data that most people never see in one place. This dashboard exists to put it in one place.
The affordability crisis is not a mystery. The numbers are all here. The question is whether we are willing to act on them.